Team Analytics Round-Up: October/November
The first quarter of the NHL season has concluded. This season is shaping up to be an interesting one. Many teams thought to be
contenders have struggled out of the gate. While a couple of teams have surprised and looked like they could make the playoffs.
What do the analytics say about each of them?
This is going to be a monthly series (except for February due to the Winter Olympics) where I break down statistics courtesy of the great people at MoneyPuck.com. The hope is that these statistics can paint a picture of a team’s performance and if their results will change later in the season. OR if their level of play is sustainable.
The most important aspect of hockey is 5-on-5 play. The table below is ranked by expected goals percentage (xGoals%).
Index: Difference between xGoals% and Goal% (Differential), Goals for above expected (GFAx), Goals against above expected (GAAx), High Danger shots for/against
(HDSF/A), Medium Danger shots for/against (MDSF/A), Low Danger shots for/against (LDSF/A), Percentage of Shots taken by the team (Corsi%)
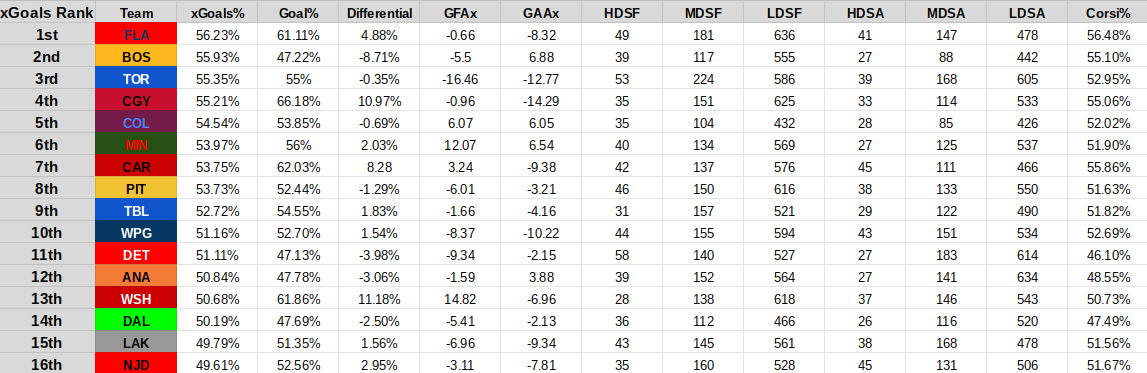

The Florida Panthers have driven play at a high level. They also own the highest Corsi% in the NHL. Five of the top eleven teams
in the NHL in xGoals% are in the Atlantic Division. It is safe to say that those five teams will be competing against each other for
spots in the playoffs all season long.
Chicago, Arizona, Philadelphia, and Ottawa are all at or below 45% xGoals. All four of these teams also struggle to convert their
5-on-5 chances into goals as well. They all have a negative GFAx, meaning they score fewer goals than their chances indicate they
should. I expect these four teams to be near or at the bottom of the league for most of the season unless they turn around their level
of play.
Washington, Carolina, and Calgary all have a high differential between their xGoals% and their Goals%. This leads to the
conclusion that all three teams have gotten either a high level of goaltending (Calgary), a high level of scoring touch (Washington),
or a healthy mixture of both good goaltending and good scoring (Carolina). The differential, as well as the records of these teams,
will begin to cool down heading into December and January (Carolina’s differential and record have already begun to cool down).
Seattle and Boston have the two lowest differentials in the NHL at the moment. Neither of these teams has gotten goaltending to
support their teams. And Boston’s scoring is struggling to capitalize on their chances. I would guess Boston will call Tukka Rask’s
number pretty soon in hopes of stabilizing their goaltending.
Speaking of goaltending, that will be the next topic to be broken down by statistical analysis.
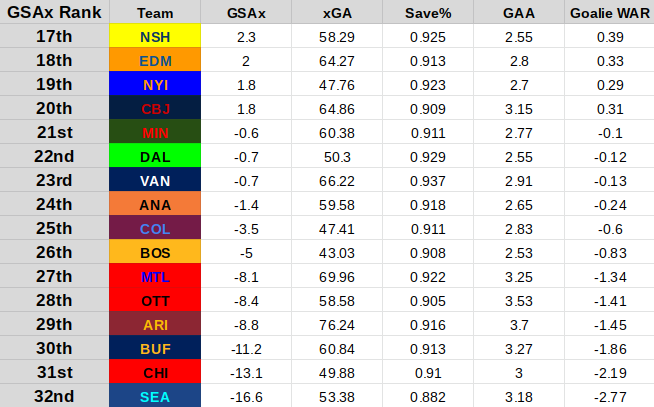
Index: Goals Saved Above Expected (GSAx), Expected Goals Against (xGA), Goals Against Average (GAA), Wins Above Replacement from goaltending (Goalie WAR)
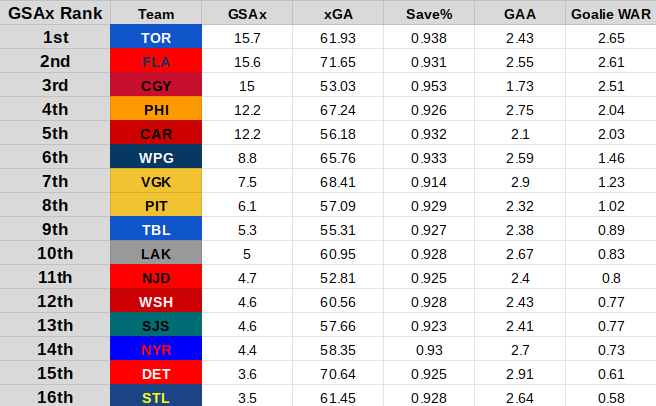
Toronto and Florida have both gotten insane goaltending to start the season. Florida has ridden the back of Sergei Bobrovsky in
the net, while Toronto has ridden with Jack Campbell. Both of these goaltenders lead the NHL in individual GSAx.
As mentioned above, Boston and Seattle have had more subpar goaltending. Their goaltenders have struggled mightily
(especially Seattle’s). Boston has the offensive firepower and elite defense to overcome these struggles. While in Seattle, they are
a solid team. But they do not have either an elite offense or defense to help soften the blow of their goaltending. These flaws are
why they are in the position they are in when it comes to the standings.
The Rangers and Penguins each have some of the best goaltenders in the NHL. Shesterkin has the third-best GSAx in the league,
while Tristin Jarry has the fourth-best GSAx in the NHL. Yet their team goaltending is far below their starter’s numbers. This is
because each of their backup goalies has struggled a lot this season. Rangers backup Alexander Georgiev has been one of the
worst goalies in the NHL, ranking fifth-worst in GSAx with a -8.2. Penguins backup Casey DeSmith has the sixth-worst GSAx
in the NHL with a -6.4. New York and Pittsburgh need to figure out a way to get better performances from their backups or look
for a new one.
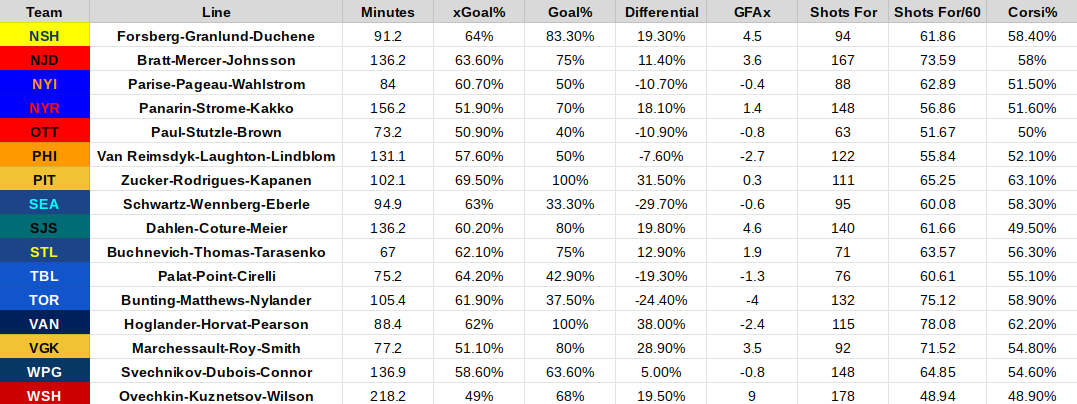
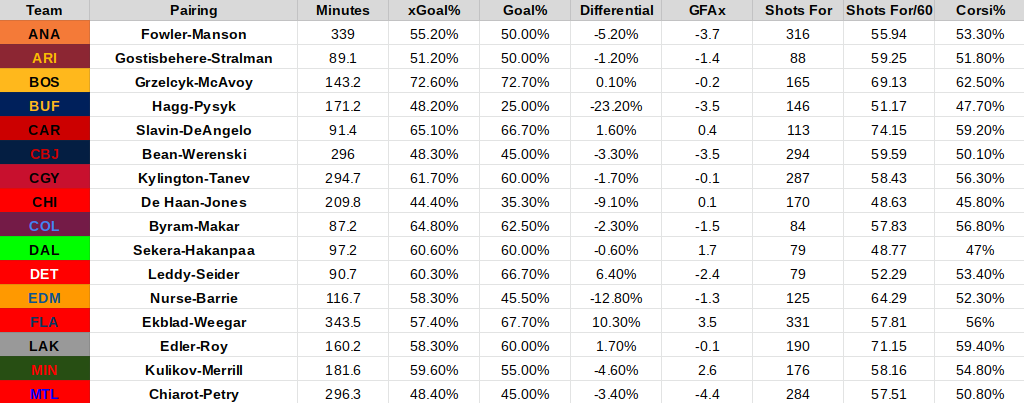
The final category is how each team’s top statistical line and defensive pairing has performed 5-on-5. Each line or pairing is not
necessarily the line or pairing that plays the most for their teams. Rather they are the best line or pairing according to xGoals%
and other stats. The minimum playtime requirement for forwarding lines was 60 minutes, while defensive pairings must have
played 80 minutes.
Index: Time played together (Minutes), Team Expected Goal Percentage when on the ice (xGoal%), Team Goal Percentage when on the ice (Goal%), Goals for
above expected when on the ice (GFAx), Team Shots for when on the ice (Shots for), Team Shots-per 60 minutes when on the ice (Shots For/60), Percentage
of Shots taken by the team when on the ice (Corsi%)
Forward Lines

Defensive Pairings

The best offensive lines in the NHL on this table ranked by xGoals% are the Tkachuk-Lindholm-Gaudreau line and the
Zucker-Rodrigues-Kapanen line. Both produce a large number of chances, and both lines dominate the Goals% statistic
as well. Both lines also control 60% or more of the shot rate when they are on the ice. These lines are big reasons why
Calgary and Pittsburgh are both near the top of the NHL in 5-on-5 xGoals% as teams.
The Canucks line of Hoglander-Horvat-Pearson and the Bruins perfection line of Marchand-Bergeron-Pastrnak are elite at
creating and taking shots. Both create at or above 77 shots/6. Boston’s perfection line was expected to be near the top of the
league statistically, but Vancouver’s line is something that is a welcome surprise for them. The Canucks may not have many
bright spots, but that top line is one of them.
Boston is once again a topic of discussion when it comes to its great analytics. This time it is about their top pairing of
Grzelyck-McAvoy. They are the best in the NHL when it comes to xGoals%. They do not give up many, if any chances,
while also producing possession and controlling the shot rate at 62.5%. The two played together in college, so it is no
surprise their chemistry has transitioned seamlessly to the NHL.
Tampa Bay’s pairing of Sergachev-Foote may be something they do not use regularly, but Jon Cooper may want to consider
using them together more. The pairing when on the ice has been dynamite. 65.13 shots/60 is nothing to sneeze at, while
the pairing also helps Tampa Bay control 63.3% of the expected goals when they are on the ice.
The Rasmus Ristolainen and Seth Jones trades looked bad in the off-season. Now two months into the season itself, the two
trades still look bad. I get why Philadelphia and Chicago made the deals for the two defensemen, but neither has lived up close
enough to what the two teams gave up.
The De Haan-Jones pairing is the best on the Blackhawks, yet they still produce a disappointing 44.4% xGoals%. Seth Jones
is supposed to carry the load on the Chicago defense. But he has yet to do that up to this point. The majority of the blame should
not be on Jones this season. The Blackhawks as a whole have been poor this season (on and off the ice). Jones has the talent
undoubtedly to bounce back this season. The Blackhawks need to give him and their other top players a supporting cast and
coach to lead them.
Sanheim-Ristolainen has also been a poor pairing so far this season. They have only produced a 45.2% xGoals%. Philadelphia is
in a similar position as Chicago was before they fired Jeremy Colliton. Alain Vigneault has been outclassed and outcoached
throughout the season so far. He also has made head-scratching lineup decisions (such as playing Nate Thompson as much as he
does). The Carter Hart and Martin Jones goalie tandem are one of the few reasons the Flyers are not near the bottom of the NHL
standings at the moment. So the blame is less so on the players, but rather on the coaches of the Flyers up to this point.
Here are the standings as of December 1st (Via NHL.Com).
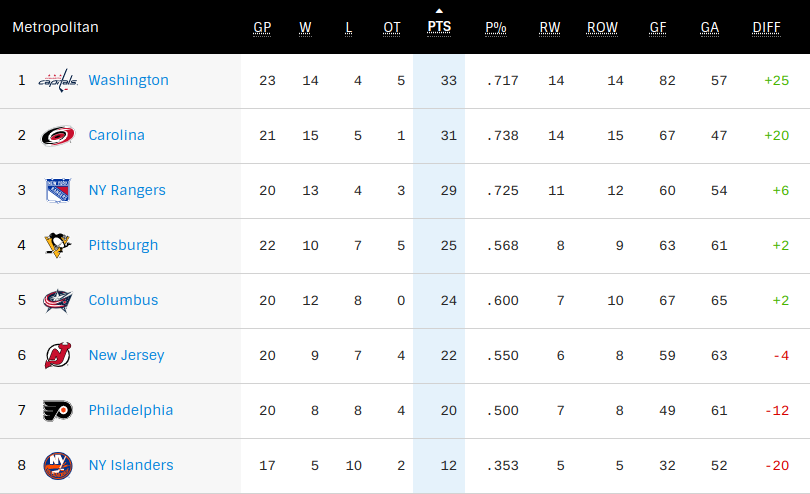


In the Metropolitan Division. The numbers suggest that Pittsburgh is due to rise. While Carolina and Washington’s form will dip
down as their shooting and goaltending regress closer to the mean, however, Washington does have the greatest goal scorer in NHL
history in their lineup. And Carolina’s goaltending and shooting have regressed towards the average already. So both teams may stay
at the top of the Metropolitan by the end of December.
The Atlantic Division’s top five is going to be very competitive all season long. Boston’s goaltending may turn around soon
(especially if they sign Rask back). And Toronto’s poor scoring should come back up to where it should be. If this happens, it is
likely Toronto continues their good form. And build a lead at the top of the Atlantic.
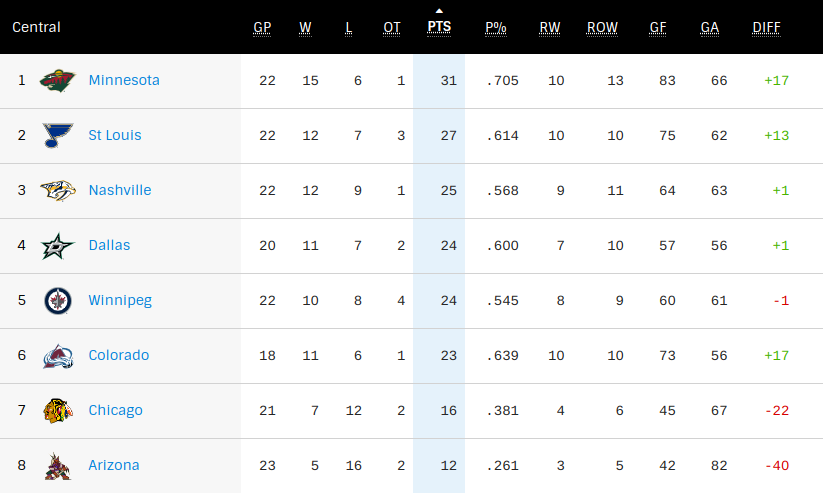
The Central Division is up in flux at the moment due to Colorado’s underwhelming start. And a lot of good but not great teams
filling out the mid-field. The underlying numbers are mildly concerning for the Blues and the Predators, but nothing serious at all.
The only near-certainty is that Colorado will climb the central division with players returning from injury. This is assuming that
their goaltending stabilizes. The middle four spots will be tight all season long. Every game matters in this division.
Calgary’s numbers suggest that while their goaltending has been great this season, this team is a legit contender. It should not
surprise in the slightest if they stay near or at the top of the Pacific Division this season. Edmonton will always be an elite
power-play team, so their iffy 5-on-5 numbers should not concern anyone in the regular season. Vegas has dealt with injuries up
front, which has for sure affected their 5-on-5 numbers so far, but their defense has been appalling. The goaltending duo of
Lehner and Brossoit have held Vegas together for now. Even with Eichel coming into the fold, this could be a team that disappoints
and even slips out of the playoff race if their defense does not improve.


Comments
Post a Comment