Team Analytics Round-Up: January

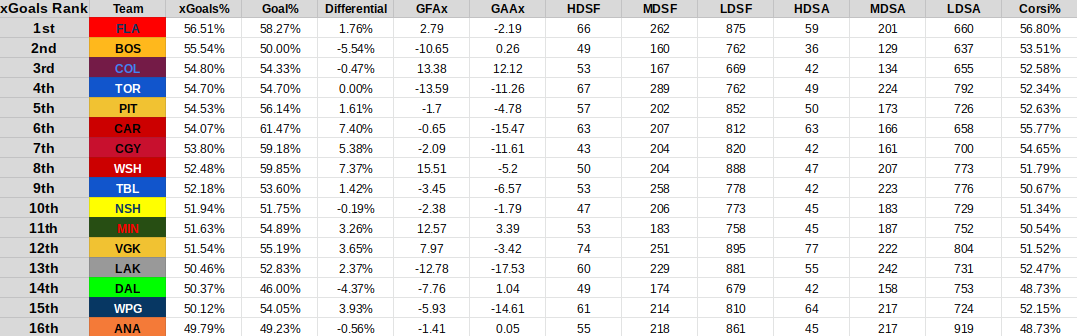
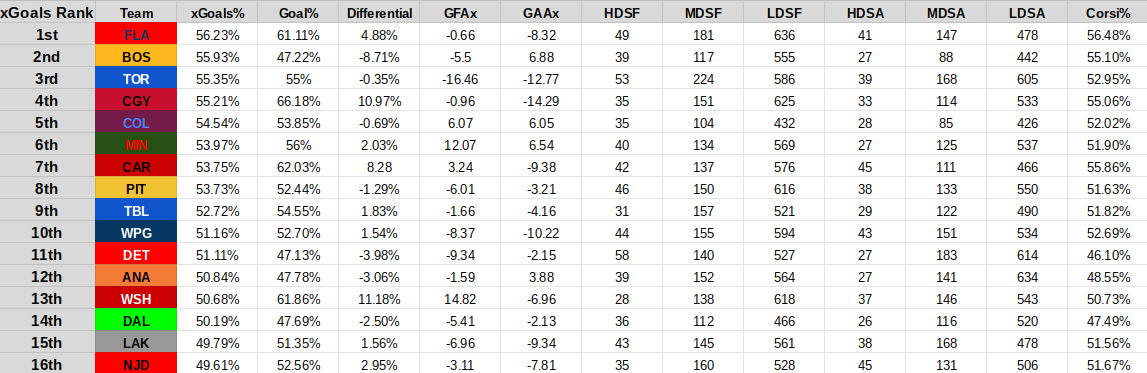
Welcome back to this monthly series. Statistics used are from the great people at MoneyPuck.com . The first analytics article covering October and November https://nhl20212022.blogspot.com/2021/12/team-analytics-round-up-octobernovember.html The second analytics article covering December https://nhl20212022.blogspot.com/2022/01/team-analytics-round-up-december.html The month of January is over, and the NHL has reached the all-star break. How good or bad is every team is doing statistically over the past three months? All stats are as of February 1st. As usual, the analysis will begin with the 5-on-5 statistics from around the NHL. The table is ranked by xGoals percentage from best to worst Index: Difference between xGoals% and Goal% (Differential), Goals for above expected (GFAx), Goals against above expected (GAAx), High Danger shots for/against (HDSF/A), Medium Danger shots for/against (MDSF/A), Low Danger shots for/against (LDSF/A), Percentage of Shots taken by the team (...