Team Analytics Round-Up: January
Welcome back to this monthly series. Statistics used are from the great people at MoneyPuck.com.
The first analytics article covering October and November
https://nhl20212022.blogspot.com/2021/12/team-analytics-round-up-octobernovember.html
The second analytics article covering December
https://nhl20212022.blogspot.com/2022/01/team-analytics-round-up-december.html
The month of January is over, and the NHL has reached the all-star break. How good or bad is every team
is doing statistically over the past three months?
All stats are as of February 1st.
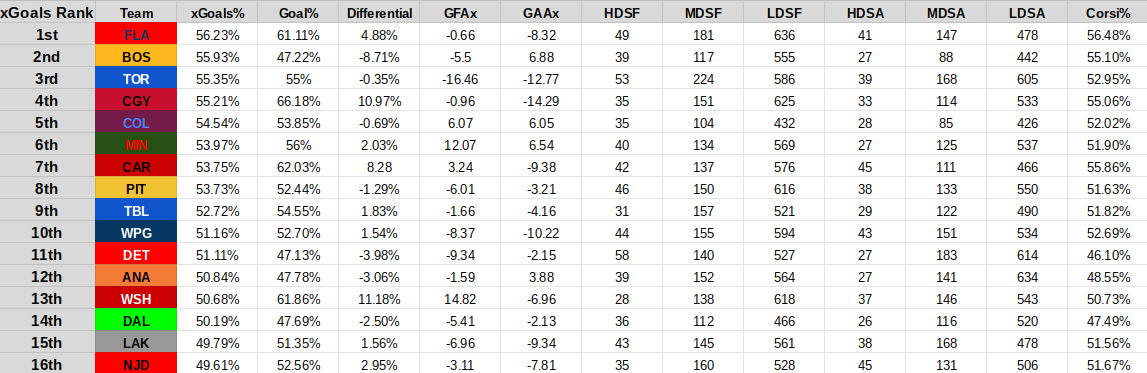
As usual, the analysis will begin with the 5-on-5 statistics from around the NHL. The table is ranked by
xGoals percentage from best to worst
Index: Difference between xGoals% and Goal% (Differential), Goals for above expected (GFAx), Goals against above expected (GAAx),
High Danger shots for/against (HDSF/A), Medium Danger shots for/against (MDSF/A), Low Danger shots for/against (LDSF/A),
Percentage of Shots taken by the team (Corsi%)

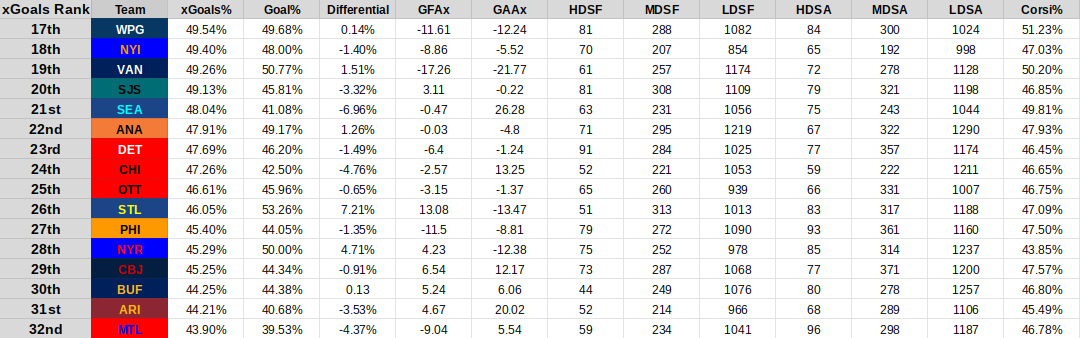
Calgary went on a tear in the month of January, they climbed from 53.8 percent xGoals to league-best
56.19 percent. Their play has picked up a lot, and it will be interesting to see how they perform in the 2nd
half of their season. The Kings have also played very well as of late, their xGoals percentage went from
50.46 at the end of December, to 52.54. The notable thing holding back the Kings is their lack of finish.
They have the lowest GFAx in the NHL at -19.76. The Islanders are quietly getting themselves back to
form. Their xGoals% jumped from 47.89 to 49.4. They also control the quality of chances, as Trotz’s
system is designed to do. They have more HDSF and MDSF than HDSA and MDSA respectively.
Florida and Colorado dropped in xGoals percentage over January (Both by approximately 1 percent). Both
teams do make the most of their chances, so this fall-off is not too concerning, but it is something to keep in
mind moving to the 2nd half of the season. The Rangers xGoals and Corsi percentage are in freefall. Going
from an xGoals percentage of 46.64 to 45.29, and a Corsi percentage from 44.91 to 43.85. The Rangers do
keep winning, but this level of 5-on-5 play is not sustainable, especially come playoff time. The Blues are
also another team in freefall. They have gone from an xGoals percentage of 47.05 to 46.05. Their stout
goaltending from Ville Husso as of late has kept them from falling far in the standings, but they will need to
be better if they want to make the playoffs in the competitive western conference.
The next statistical category in the breakdown is team goaltending.
Index: Goals Saved Above Expected (GSAx), Expected Goals Against (xGA), Goals Against Average (GAA), Wins Above Replacement from
goaltending (Goalie WAR)


Unsurprisingly, Seattle is still at the bottom of the NHL in goaltending. New Jersey’s goaltending has
trended further downward. The Devils are not that bad of a team, but their goaltending has been quite bad
up to this point. Edmonton’s goaltending continues to be a concern for a team that is wasting McDavid and
Draisaitl.
On the positive side of goaltending, LA, Florida, and Colorado's goaltending continues to climb. An Avs
team with legit goaltending will be near unbeatable come playoff time. The Rangers are also being treated
to fantastic goaltending. Led by the likely Vezina leader Igor Shesterkin.
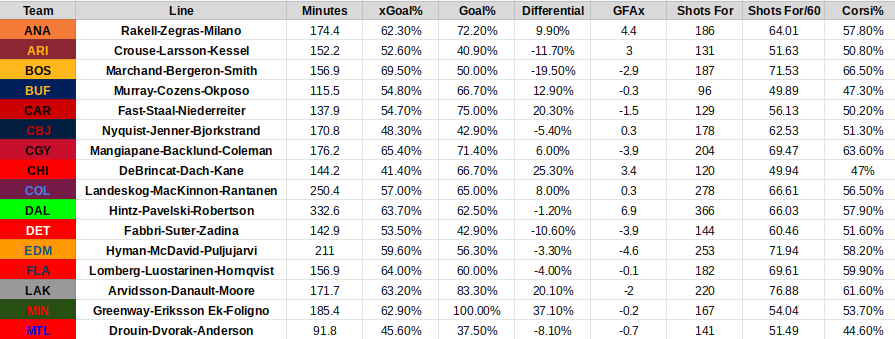
The final breakdown is what each team’s top pairing and forward line are. And how they are doing
compared to other top forward lines and pairings across the NHL. The minimum ice-time requirement for
forward lines is 120 minutes, and the minimum ice-time requirement for defensive pairings is 150 minutes.
*Note* Some teams once again did not have a line that hit the exact 120-minute minimum. So I selected the
best line that was reasonably close to the 120-minute mark.
Index: Time played together (Minutes), Team Expected Goal Percentage when on the ice (xGoal%), Team Goal Percentage when on the ice
(Goal%), Goals for above expected when on the ice (GFAx), Team Shots for when on the ice (Shots for), Team Shots per 60 minutes when on
the ice (Shots For/60), Percentage of Shots taken by team when on the ice (Corsi%)
Forward Lines
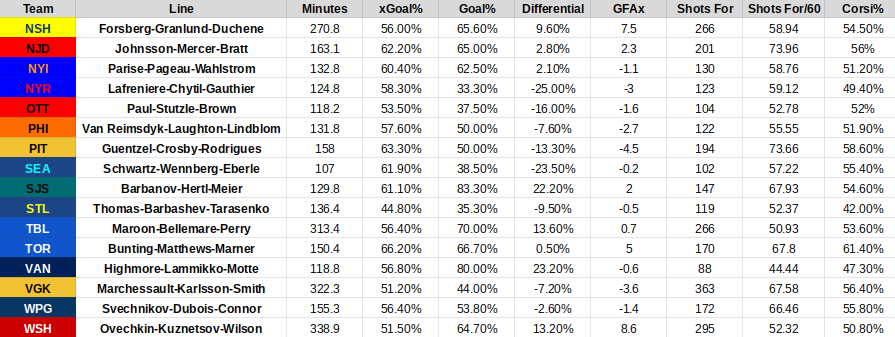
Defensive Pairings


Calgary’s top line in terms of performance has switched from Gaudreau-Lindholm-Tkachuk to
Mangiapane-Backlund-Coleman. The MBC line is also one of the best lines in the NHL. Producing a
65.4 xGoals percentage, along with 69.47 shots/60. Calgary’s top two lines have been outstanding up to
this point, and they are big reasons why the Flames are a dangerous team moving forward. Toronto’s lines
have shuffled a little bit, but their top line has been Bunting-Matthews-Marner. These three have worked to
a 66.2 xGoals percentage, the best in the NHL behind only Marchand-Bergeron-Smith. The three Bruins
since being put together have been outstanding in every aspect of the game 5-on-5. Producing shots at a
71.53 per 60 rate, and controlling the puck with a 68.5 percent Corsi.
The top-5 forward lines in the NHL ranked by xGoals
1: BOS Marchand-Bergeron-Smith 69.5 percent
2: TOR Bunting-Matthews-Marner 66.2 percent
3: CGY Mangiapane-Backlund-Coleman 65.4 percent
4: FLA Lomberg-Luostarinen-Hornqvist 64 percent
5: DAL Hintz-Pavelski-Robertson 63.7 percent
The Slavin-DeAngelo pairing has been one of the highest action pairings in the NHL. They have 65.03
shots/60 yet have a Corsi percentage of only 53.1 percent. Fitting that Carolina’s top pairing helps create a
lot of offense, but also gives up a lot of shots. Yet this pairing still controls the quality of chances, producing
a 59.7 xGoals percentage. The best defensive pairing in the NHL that is not Grzelcyk-McAvoy is
Sandin-Liljegren. The two Maple Leafs have combined for 65.3 percent xGoals, and 64.28 shots per/60.
The Toews-Makar pairing may have a respectable 54.3 percent xGoals. But their offensive production has
been great. Their goal for percentage is at 71.4 percent. Not surprising when thinking about two superstar
defensemen on a great hockey team.
The top-5 defensive pairings in the NHL ranked by xGoals
1: BOS Grzelcyk-McAvoy 70.8 percent
2: TOR Sandin-Lijlegren 65.3 percent
3: LAK Edler-Roy 60.9 percent
4: CAR Slavin-DeAngelo 59.7 percent
5: CGY Kylington-Tanev 59.3 percent
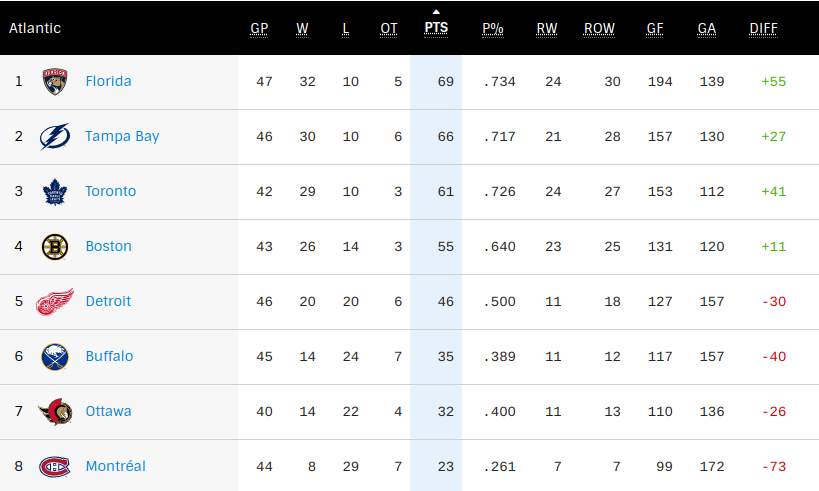
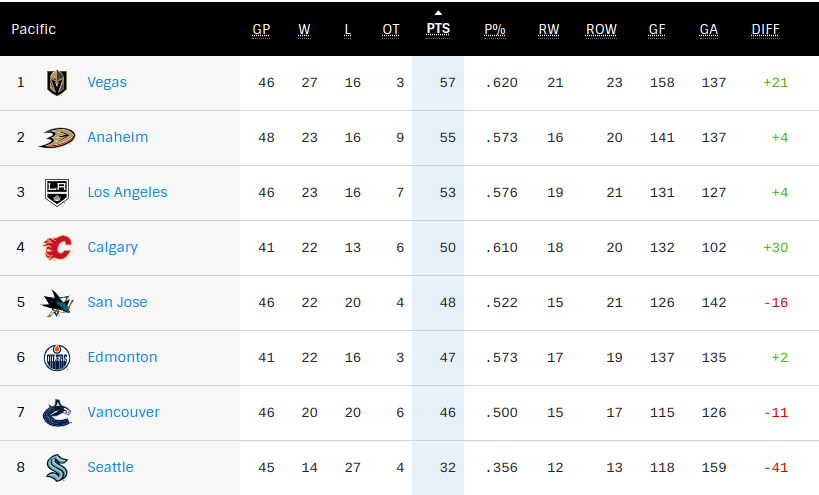
Here are the standings as of February 2nd (Via NHL.com).


In the Metropolitan Division, the Hurricanes seem to have a strong handle on it as of right now. They have
games in hand on both the Rangers and Penguins. The Rangers will need Shesterkin and their power-play
to continue to stay hot if they want to avoid being a wild-card. As the Capitals and Penguins are right
behind them, and with better underlying stats. The Islanders are playing better, but they will need to go on a
tear if they want to sneak into the playoffs. The Jackets have fallen recently in the standings and in their
level of play. And the Flyers and Devils are both bottom-feeders, and it seems as if their playoff hopes are
certainly done for this season.
In the Atlantic Division, the Panthers, Lightning, and Maple Leafs are all very close in the standings, and in
their underlying stats. Whoever wins the division will be very happy that they do not have to face one of the
other two teams in the playoffs. The Bruins have strong 5-on-5 stats, but their depth has still struggled, along
with their goaltending. These two factors have cost them a chance at getting out of a wild-card spot for the
time being. The Wings have fallen from grace this season a little bit, but their young core is just getting
started. The Sabres, Senators, and Canadiens are all teams who have struggled to say the least.
The Central Division has a lot of shaping up to do before we hit the playoff push. The Avs are the top team
in the division. But the Wild, Preds, Blues, Jets, and Stars are close in the standings, and in their level of
play. Whoever gets the other two guaranteed spots in this division will have more than earned it. Chicago
has played better, but their awful start to the season seems to have hurt them a lot. Meanwhile, the Coyotes
are looking forward to a new season. And a new arena with 5,000 seats.
The Pacific Division is also wide open. A healthy Vegas on paper seems to be the clear number 1, but
Calgary is an outstanding hockey team that can beat anyone on any night. The third guaranteed spot is wide
open for anyone else to take. Except for Seattle, who may want to consider selling at the deadline and tanking
for Shane Wright.


Comments
Post a Comment